LEAGUE OF LEGENDS
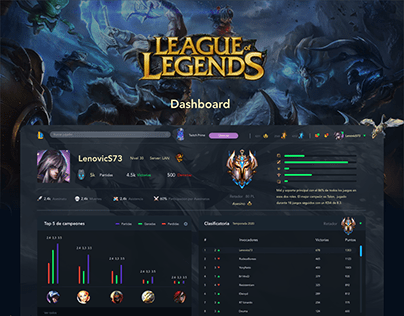
League of Legends Dashboard is an analytical panel concept that transforms player performance statistics into intuitive and visually engaging visualizations. The design targets competitive players from Gold to Challenger rank who seek actionable insights beyond the numeric tables offered by tools like op.gg or u.gg. Its differentiator is visually connecting every data point to the game's aesthetic identity, so that analyzing statistics feels like a natural extension of the LoL experience.
Design — Gaming
The dashboard integrates League of Legends' visual identity into every component: radial charts display performance by role with each position's colors and iconography, while an interactive timeline walks through recent matches highlighting key moments like first blood, dragons, and barons. The visual comparison against rank average lets players identify strengths and weaknesses at a glance. The entire design is responsive with native dark mode, optimized for extended analysis sessions between matches.
Discovery
Brief · Stakeholders · Goals
Research
Benchmark · Users · Competition
UX Architecture
User Flows · Wireframes · IA
Visual Design
Tokens · Layout · Components
